Blog
Feature highlight: Banner Analytics
Knowing how your advertising dollars are performing in every retail channel and measuring Share of Voice is imperative to understanding your digital retail performance.
What are the benefits of using Banner Analytics?
Our Banner Analytics solution will let you understand your Share of Voice in each of your digital retail channels. There are many benefits to using our solution:
- Get data that is often restricted by retailers or advertising partners
- Replace repetitive, error-prone, manual work
- Augment data provided by retailers giving a more complete view with more metrics
- Consolidate data from multiple retail channels into one dashboard
- Measure ROI by knowing your Share of Voice in every online retail channel
Incorporating our solution, gives you a strong understanding of your retailer-specific media spend. This ensures that you are designing effective campaigns and deploying them at the right time in the best channels for a stronger ROI.
How does Brandquad’s Banner Analytics work?
The Brandquad platform collects and gathers data automatically from any retailer website that you desire, daily. This means that you have the data that you need when you need. Giving you and your team the ability to start tracking any retailer in any country or region means that you can scale up your data collection at any moment. The data you want will be collected from all your retailers and easily accessible in one centralized place.
What are the types of data that I can expect from Banner Analytics?
We developed our module to collect data points that are not highly complementary to the data that is being collected by other web analytical tools you are probably using. These other tools are collecting data such as traffic, clicks, conversion, etc. Our module can gather other data points to give you a more complete picture that is unavailable in the other tools.
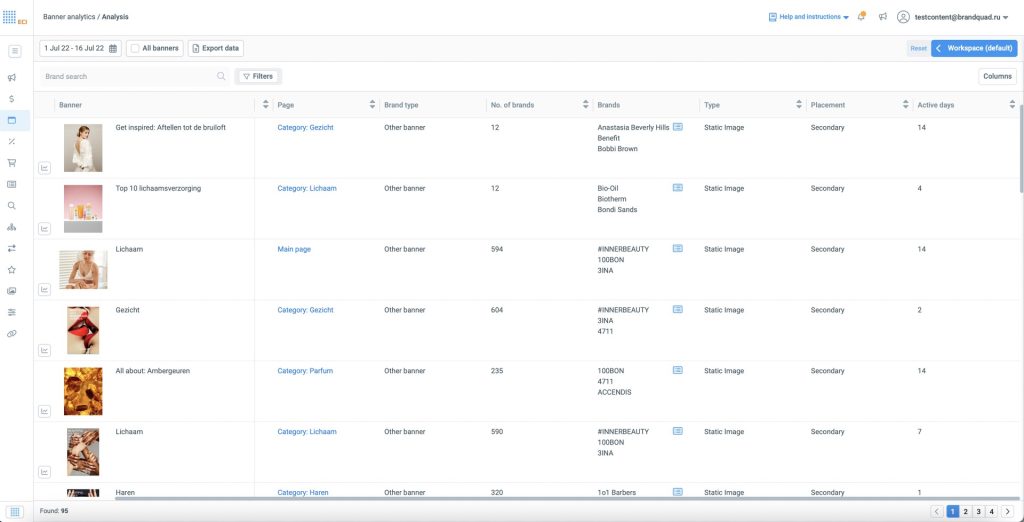
- Banner image: have the image of the advertisement readily viewable
- Type of display: understand whether the banner is presented as a static standalone banner or included in a carousel of banners
- Store/channel name: quickly know which retailer the banner is found on
- Placement page: identify which specific page the banner is located
- Ad block placement: know where on a page the banner is placed (header, footer, primary, secondary position, etc)
- Brand type: understand if the banner is displaying only your brand or multiple brands
- Brands included: know how many brands and which brands the banner is driving traffic to
- Active days: see how many days the banner is being displayed
How do I use this data to improve my digital shelf performance?
This data will give insight on your share of voice compared to other brands in every one of your retailers. You can adjust your spend to increase share of voice or brand awareness.
To take it even further, you can integrate this data with conversion data and data from retailers to make strategic product decisions within a larger context.
If you are interested in learning more about banner analytics and how it can help your business, sign up for a quick demo with our team.