Blog
Feature Highlight – Availability

Availability module lets you check the health of your e-shelf by having an overview of your products out of stock rates. The KPI “Availability” shows an average percentage of products which are available on the e-shelf within the selected period.
Consistent product availability is the essence of a positive shopping experience for the consumer.
Brandquad’s Availability module gives you an overview of the share of product availability on your tracked retailers (in stock vs out of stock). Benchmark the health of your e-shelves against competitors using the KPI dashboard to ensure that you are meeting your objectives.
Why is it important to track the availability of your products?
Monitoring the availability of products allows you to quickly obtain the information about their availability for purchase. This gives you the insights to reduce the Out of Stock rate in online stores to the optimal level.
As a brand, you want your consumers to be able to buy your products when they want to. Out of stock products means lost revenue and negative product experience. It’s also important to minimize out of stock rates because it negatively impacts your visibility in retailers, pushing your product to the bottom of search results or in a category. It can be difficult to recover in the ranking algorithm after this fall. This feature quickly and easily gathers the data on which products were out-of-stock and in which channels. With this information, you can quickly identify and address stocking issues.
What are some benefits of the Availability module?
This ECI feature empowers you to take many different actions that can significantly impact your revenue.
One of the biggest benefits we see from our clients is analysing how many potential sales were lost per channel because of the unavailability of the products. You can share this data with the retailers and work together to reevaluate logistics and stock management. By reducing your out of stock rate, you increase your opportunity for additional sales.
The Availability data gives you an additional data point to consider when doing your demand forecasting across channels. Knowing which products are out of stock in which channels ensures you get the right products, in the right amount, to the right customers.
What type of information can I get from the Availability module?
→ Your own products’ out-of-stock rate
→ Out-of-stock situation for best selling SKUs
→ Products’ availability percentage changed over time.
→ Availabilty data on competitor products
→ Average percentage of product availability over analyzed period – breakdown by online stores, brands, categories.
→ Quantity of brand products with the “Out of stock” status in a defined period
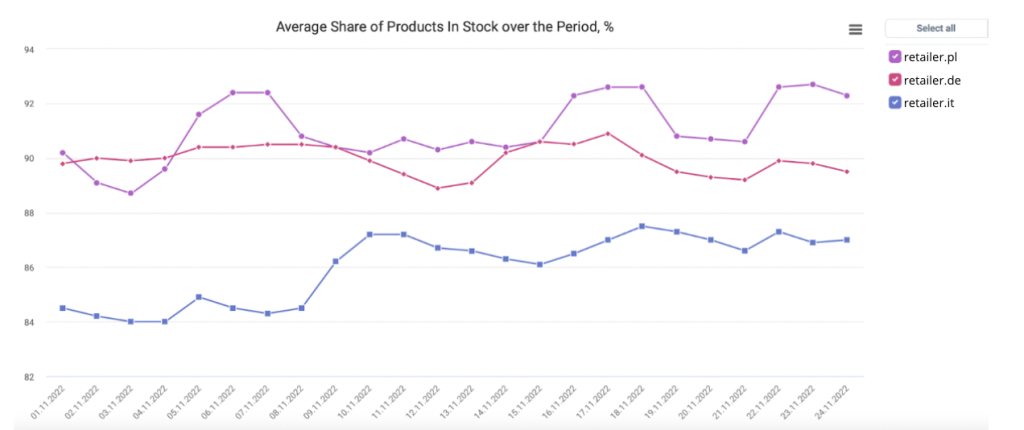
Let’s take a look at an example.

On this graph we see availability of products of own brands over the period of November (MTD – Month to date). We can see that in retailer.de the availability fluctuates significantly.
There are peaks that probably indicate restock happens on those dates. But then we see a quick decrease until the next delivery. This means that there’s an opportunity to review the demand and delivery forecast for those SKUs that go out of stock quickly and supply a bit more units or we could increase the frequency of replenishment.
We also see on the graph that retailer.pl has the lowest availability rate, meaning there might be some problems with replenishment. Those could be smaller quantities not in line with the actual demand or late deliveries (to retailer.pl warehouse). At the same time we see positive dynamics over the period. Perhaps this is a positive result of some changes that have been taken.
To finish :
It is interesting to ask yourself how are you monitoring your out-of-stock rates online. Are you losing out on sales due to poor online availability on certain retailers? Reach out to one of our digital shelf specialists if you are interested in learning more about our ECI solution and how it can help your business.
You can also sign up for a quick demo with one of our expert.

