Blog
Feature Highlight – KPI Dashboard
Automatic calculation and evaluation of KPI metrics will allow you to quickly obtain information about your company’s effectiveness in e-commerce in order to make informed decisions on further development in this area.
What are KPI’s and why are they important ?
A Key Performance Indicator (KPI) is a measurable value that demonstrates how effectively your company is achieving its key business objectives. KPI’s are used to track progress and performance in a specific area of a business, such as sales, marketing, operations, customer service, or finance.
They provide a clear and quantifiable way to measure the success of a business strategy or initiative.
The selection of the right KPI’s is crucial, it depends on the business goal or strategy.
By selecting the right KPIs, you can track the progress and measure the success of your efforts.
What’s Bradnquad’s KPI Dashboard module?
Brandquad’s KPI Dashboard is a tool used to track and analyse important metrics and data related to a specific business or project.
The goal of KPI dashboard for digital shelf analytics would be to help businesses understand how their products are performing on ecommerce platforms and identify areas for improvement.
Out of the metrics described underneath, you can choose a combination of KPIs to track. This will allow you to solve your current business issues.
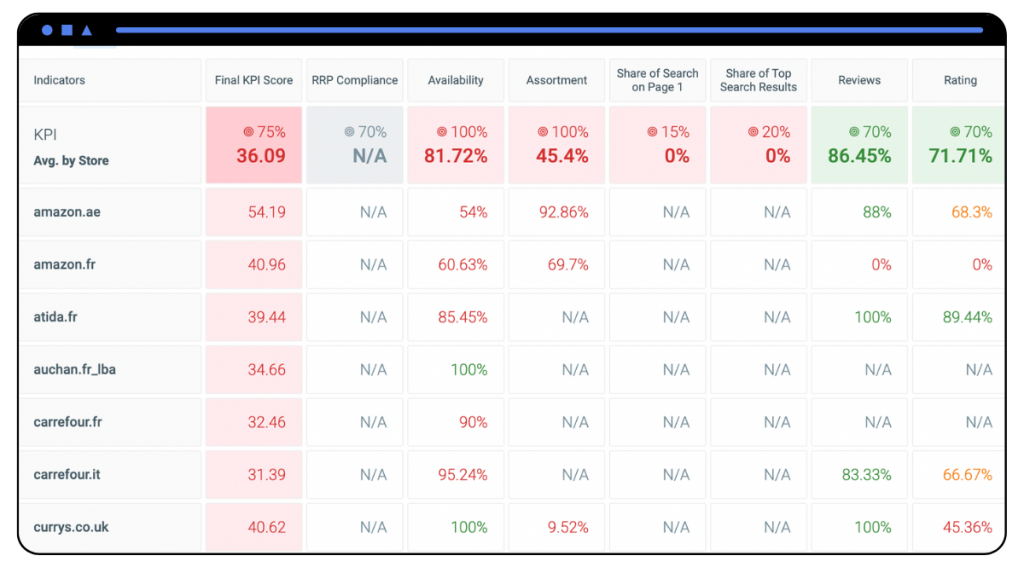
Which KPI’s are available to track?
- Correspondence to RRP compliance
- Availability
- Assortment
- Search share on the 1st page
- Search share in the TOP results
- Category search share on the 1st page
- Category search share in the TOP results
- Reviews
- Ratings
Use cases of Kpi’s Dashboard module :
Automatic calculation of KPIs will allow you to save the time required to evaluate them manually, which will ensure transparency and traceability of the results of work with each product in a competitive environment.
In addition to calculating KPIs, you can track trends and dependencies between metrics and make hypotheses to improve your sales:
- Comparison of data on the products remaining in stock, the actual price, and the recommended retail price with a reference to calendar periods will allow you to see the reasons for a sales decrease or an opportunity for a greater sales increase.
- Daily comparison of data on the product assortment of your and competitive brands on different online platforms will allow you to understand the strategies used by your competitors and to dominate specific niches.
- Comparison of text descriptions and images in retailers’ product cards with the Brandquad system will show you which retailers update product information too late or incorrectly or which product cards lead to better sales and why.
- Comparison of KPIs that show the search and category results will allow you to understand which of your product groups are at the highest positions in the search on retailers’ websites. You can develop a strategy for further product sales based on these data and optimise product card content.
- Analysis of KPI indicators by reviews and ratings will allow you to systematically process all requests without the need to manually check them at each online platform.
If you are interested in our ECI digital shelf analytics module and would like to know more about our solutions, book a demo and reach out to our team of digital shelf experts!